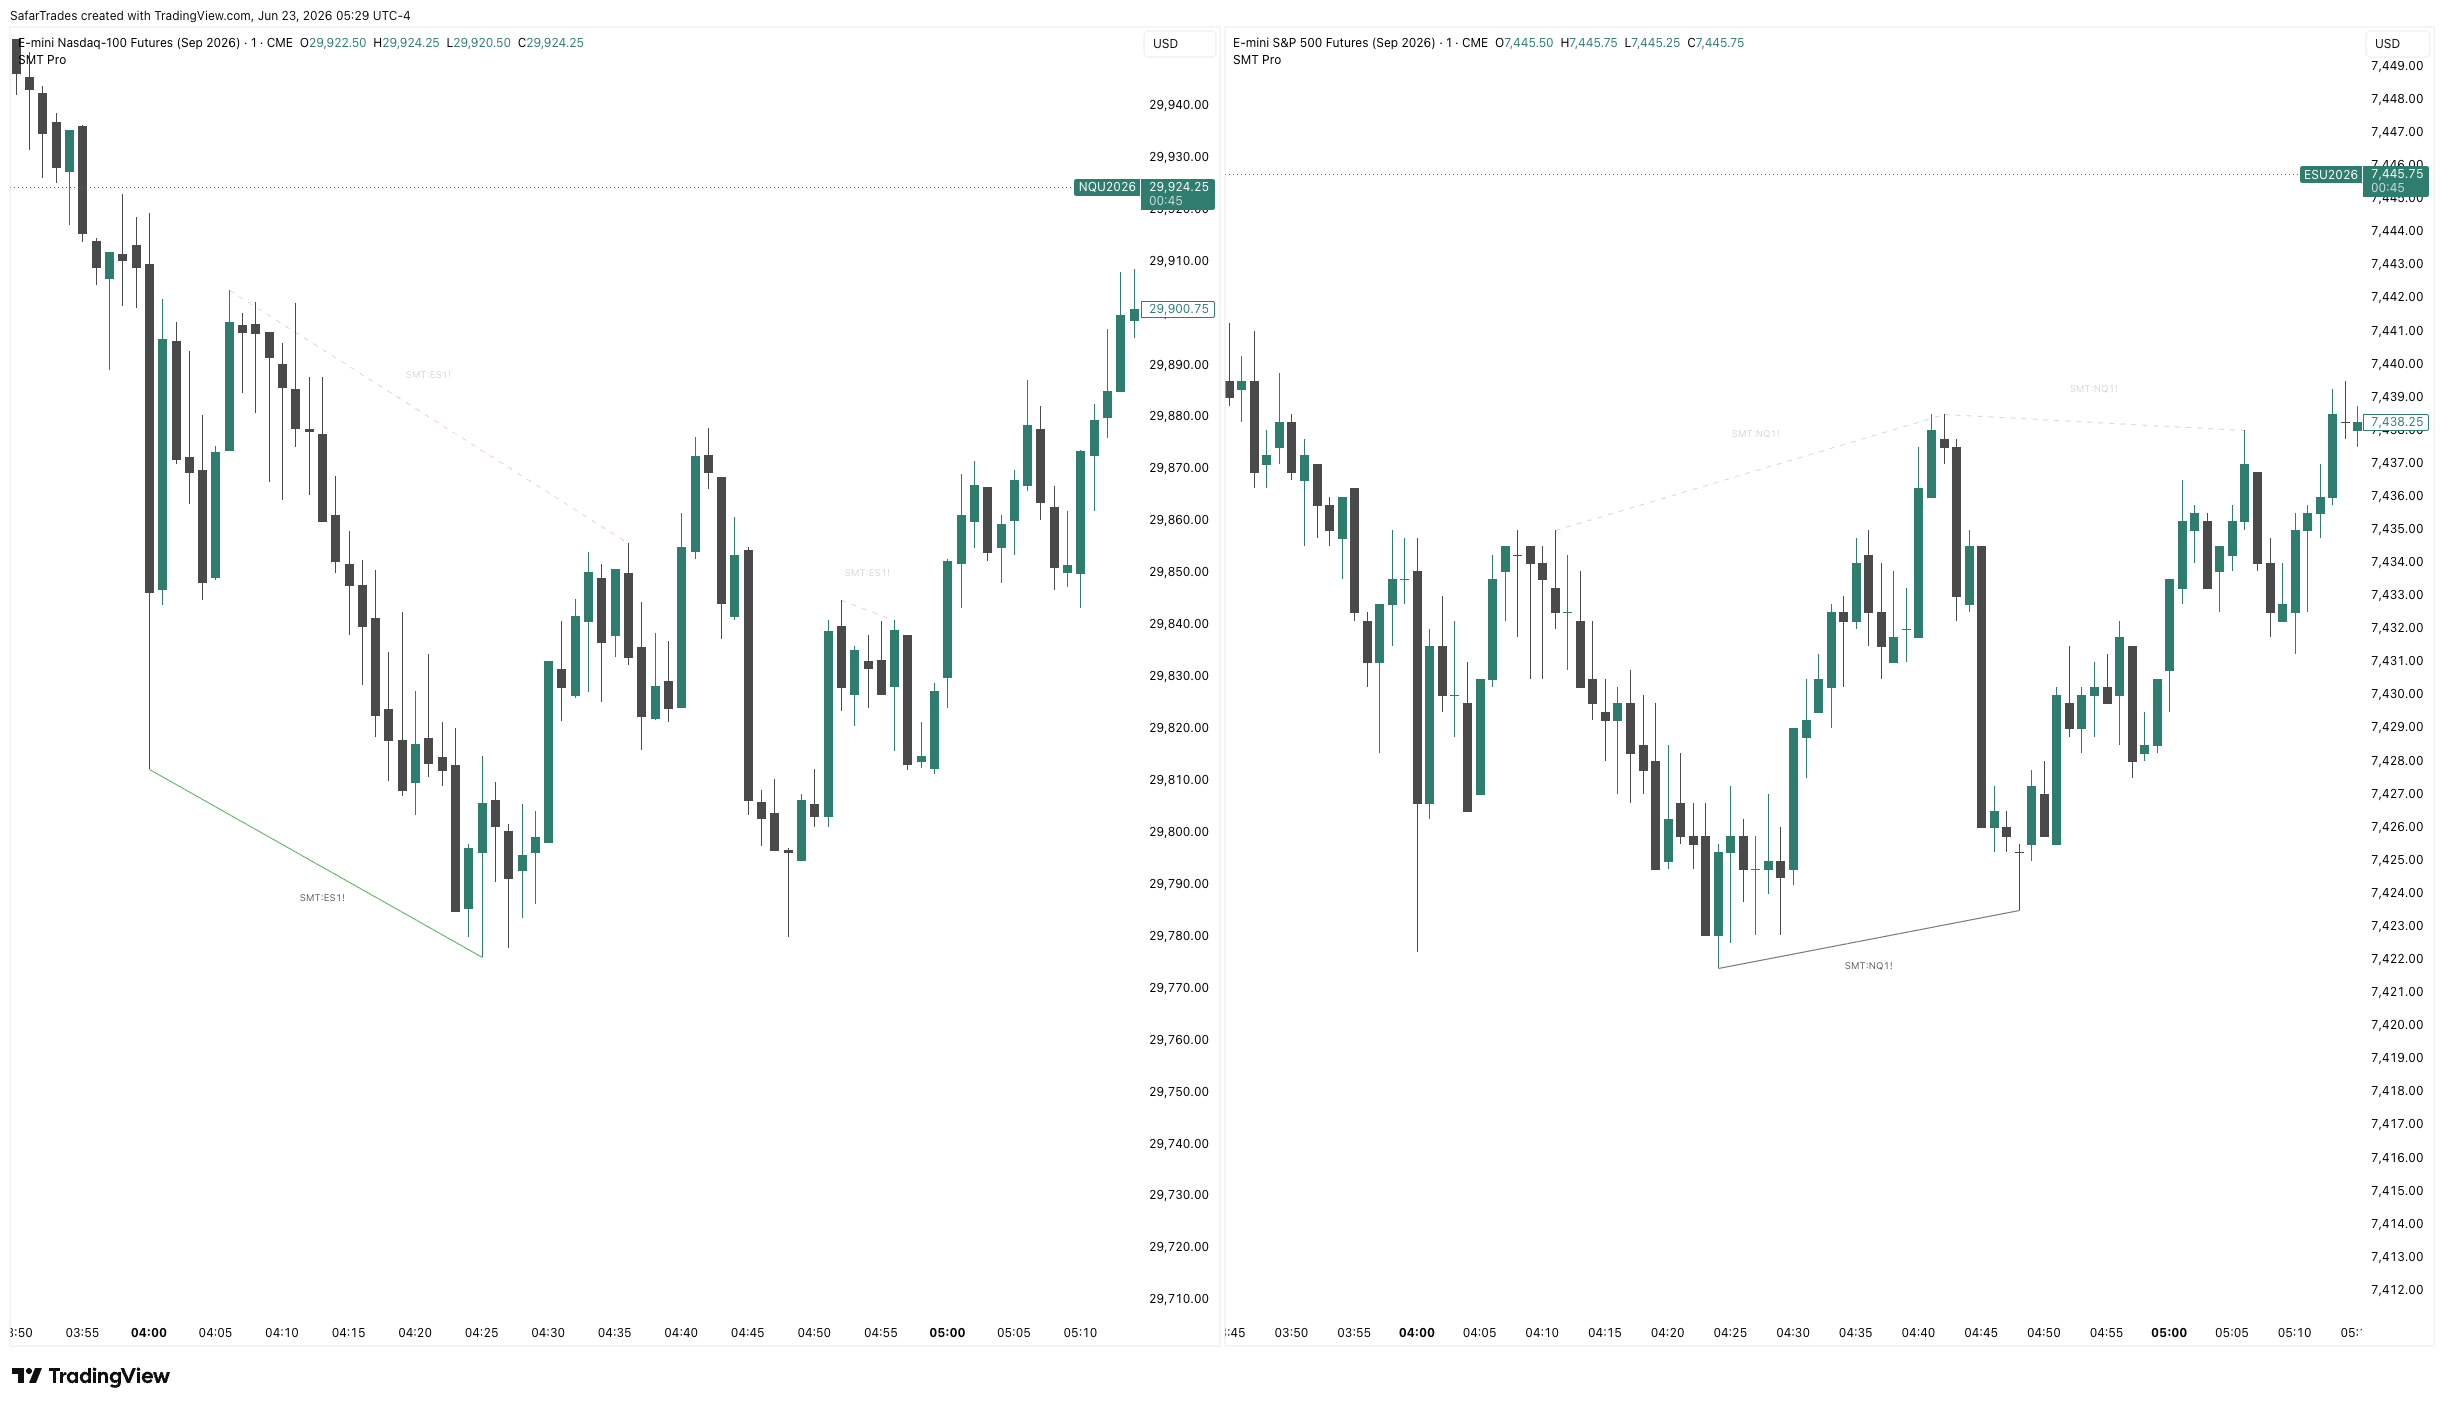
Welcome to this week’s systematic market outlook. We begin by analyzing the price delivery from last week and mapping our key interest zones for the upcoming sessions on S&P500 (ES) and Nasdaq (NQ).
Weekly Recap & SMT Divergence
Last week, we saw clear institutional accumulation on NQ while ES lagged behind. This created a significant SMT Divergence at the weekly lows:
- NQ: Swept its previous weekly low, delivering a clean liquidity grab.
- ES: Failed to sweep its weekly low, printing a higher low.
This divergence signaled that market makers were heavily buying NQ, leading to a strong midweek rally that took out the relative equal highs at the top of the range. Our SMT Pro indicator picked up this divergence in real-time, giving systematic traders an early entry long signal before the shift occurred.
Outlook for the Upcoming Week
For the week ahead, our focus is on key draw on liquidity zones:
- Bullish Scenario: If price holds the Consequent Encroachment (50% level) of the weekly bullish FVG on ES, we expect a continuation upward to draw to the buy-side liquidity (BSL) at 5120.
- Bearish Scenario: If price closes daily below the weekly FVG, the draw shifts to the sell-side liquidity (SSL) resting at the monthly low of 4980.