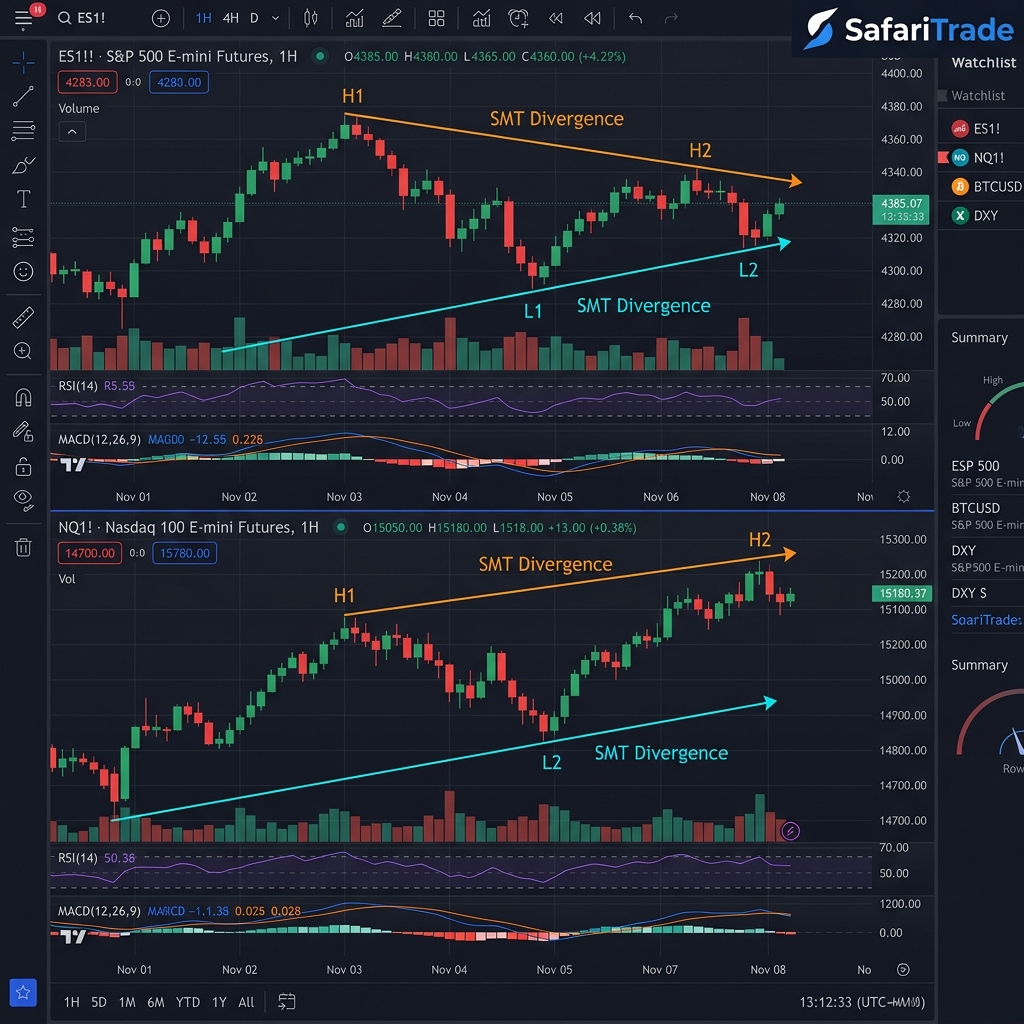
Smart Money Technique (SMT) Divergence is one of the most powerful correlation-based analysis tools used by systematic price action traders. It helps identify institutional accumulation or distribution at key support and resistance levels by analyzing the relationship between highly correlated financial instruments.
The Core Principle of SMT
In normal market conditions, closely correlated assets move in sync. For example, in the equity index markets, the S&P 500 (ES) and the Nasdaq 100 (NQ) should make higher highs and lower lows in tandem. In the foreign exchange markets, EUR/USD and GBP/USD generally move together.
An SMT Divergence occurs when this correlation breaks down. When one asset manages to break a significant swing high or swing low, but its correlated counterpart fails to do so, it reveals a hidden divergence. This indicates that one asset is being heavily accumulated (bought) or distributed (sold) by institutional players, while the other is lagging or being manipulated.
Types of SMT Divergences
- Bullish SMT: Occurs at key support levels or during a swing low sweep. For example, if NQ makes a clean lower low sweeping a previous key level, but ES fails to break its previous low (creating a higher low), this indicates bullish strength in ES. This is a strong signal that the lower low in NQ was a stop-hunt, and a sharp reversal is imminent.
- Bearish SMT: Occurs at key resistance levels or during a swing high sweep. If EUR/USD sweeps its previous swing high making a higher high, but GBP/USD fails to break its previous high (creating a lower high), this reveals bearish pressure in GBP/USD, indicating the move up in EUR/USD was a stop-hunt.
Important Rule: SMT divergence is not a standalone entry trigger. It should always be observed at institutional key levels (such as daily/weekly highs/lows, higher timeframe fair value gaps, or order blocks) during specific kill-zone time windows.
How to Trade SMT Divergence
To integrate SMT into your execution framework, follow this structured process:
- Identify an institutional level on your primary chart (e.g., a 15-minute Fair Value Gap at the London Open).
- Monitor a highly correlated secondary asset on another chart.
- Watch for a divergence to print at the key level during the Killzone window.
- Confirm the divergence with a local change in market structure (CHoCH or Market Structure Shift) on a lower timeframe (e.g., 1-minute or 3-minute chart) to trigger your entry.